I just finished benchmark packet signature times with new microcontroller. I’m getting much better results using the GD32E503. Here are my results:
GD32E503 operating a various frequencies
| CPU Clock | Pkt Sig time | Sig/sec |
|---|---|---|
| 8mhz | 0.8 sec | |
| 20Mhz | 0.317 | 3 |
| 40 Mhz | 0.161 | 6 |
| 60 Mhz | 0.106 sec | 9 |
| 80Mhz | 0.081 sec | 12.3 |
| 100Mhz | 0.0641 sec | 16.6 |
| 160Mhz | 0.0408 sec | 24.5 |
| 180Mhz | 0.036 sec | 27.8 |
This is much better than the ~1.5 seconds it was taking to sign a packet using the STM32L152 @32Mhz. As a reminder, the packet signature time really only matters for total packet RX throughput. When the Secure Concentrator receives a packet, it immediately forwards it to the Host CPU. The packet data is also placed on a queue for computing the ED25519 signature and when complete the signature is forwarded to the Host CPU. The unsigned packet is always forwarded even if the queue is full. This asynchronous firmware architecture provides the best of both worlds – data is available immediately for low latency requirements and then the packet signature comes a bit later (36ms later @180Mhz to be exact). Pretty good!
Note: this table has been updated. I originally performed this benchmark and was getting weird results (higher frequencies where sometimes much slower). Turns out there was a bug in the code that initializes the PLL clock and the result I was getting was not the correct full CPU speed.
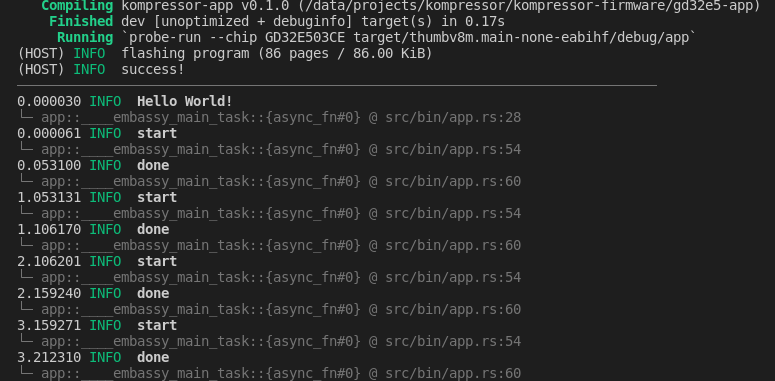
   Compiling kompressor-app v0.1.0 (/data/projects/kompressor/kompressor-firmware/gd32e5-app)
    Finished dev [unoptimized + debuginfo] target(s) in 0.17s
     Running `probe-run --chip GD32E503CE target/thumbv8m.main-none-eabihf/debug/app`
(HOST) INFO  flashing program (86 pages / 86.00 KiB)
(HOST) INFO  success!
────────────────────────────────────────────────────────────────────────────────
0.000030 INFO  Hello World!
└─ app::____embassy_main_task::{async_fn#0} @ src/bin/app.rs:28
0.000061 INFO  start
└─ app::____embassy_main_task::{async_fn#0} @ src/bin/app.rs:54
0.053100 INFO  done
└─ app::____embassy_main_task::{async_fn#0} @ src/bin/app.rs:60
1.053131 INFO  start
└─ app::____embassy_main_task::{async_fn#0} @ src/bin/app.rs:54
1.106170 INFO  done
└─ app::____embassy_main_task::{async_fn#0} @ src/bin/app.rs:60
2.106201 INFO  start
└─ app::____embassy_main_task::{async_fn#0} @ src/bin/app.rs:54
2.159240 INFO  done
└─ app::____embassy_main_task::{async_fn#0} @ src/bin/app.rs:60
3.159271 INFO  start
└─ app::____embassy_main_task::{async_fn#0} @ src/bin/app.rs:54
3.212310 INFO  done
└─ app::____embassy_main_task::{async_fn#0} @ src/bin/app.rs:60
Its interesting how 60Mhz test is slightly better than the 180Mhz. I think this is because at 180Mhz, the datasheet requires adding 4 wait states, where as at 60Mhz, zero wait states. Turns out there was a bug in my original code that initializes the PLL. Now, everything looks as expected.

